
The Halloween Effect: Trick or Treat?
By Ron William, CFTe, MSTA
Trading the Bear Market Rally
After the best month for the Dow Industrials since 1976, how long will this rally last? Is it here to stay and develop further or is it just a bear market rally that will fizzle out? What are the signs to look out for and where could it all end up?
IGTV’s Jeremy Naylor caught up with Ron William, technical analyst from RW Advisory, to find the answers.
Autumn Fall-Crash Pattern
Elevated market volatility and black swan event risk proved scary to most investors as we marked the ominous Halloween festivity. It is claimed to be influenced by Germanic and Celtic-speaking peoples commemorating the dead at the beginning of winter.
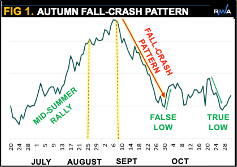
Meanwhile, in financial markets, Halloween’s (late-October) timing coincides with the aftermath of an infamous fall-crash pattern (Figure 1), which typically fuels a relief rally from oversold extremes.
Halloween’s original philosophy of “commemorating the dead” also serves as a useful metaphor of the investor behavioural realities for mourning and overcoming portfolio loss, not least during the market carnage of 2022. Typically, the worst drawdown occurs in September, as it did this year, marked by a false low, which then follows by a true low in October. Therefore, October is often remembered as the anniversary month of significant falls or crashes, notably in 1987.
Halloween Effect
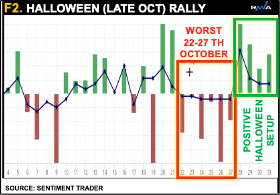
In terms of seasonality patterns, the drawdown impact often triggers a so-called ‘Halloween Effect’ (HE), akin to the mythological phoenix rising from the ashes. Intra-month analysis shows the worst of the drawdown on average is between 22-27th October, setting up the HE into month end (Figure 2).
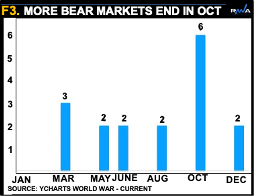
The upside reversal often signals a temporary or end to the bear market (Figure 3), thereby leading to the “Best Six Months” (BSM) of market performance.
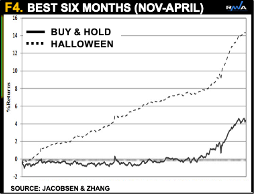
Peer-reviewed papers show how well this seasonal pattern has worked for centuries, by a statistically significant amount (Figure 4); with November-April (BSM) outperforming May-October, known as the “Worst Six Months” (WSM), or “Sell in May & Go away”.
The big question now is will this coming HE trick-or-treat investors?
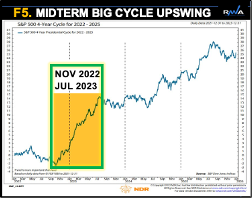
Further support is offered by the pending US mid-terms which historically triggers one of the most bullish phase of the four-year election cycle, according to Ned Davis Research (NDR) (Figure 5).
But with the macro backdrop seemingly terrible, which will win?
The presidential cycle is more than markets randomly shifting trends after midterms. It’s the combination of monetary and fiscal policy that typically bottoms before midterms and accelerates through the pre-election year. The NDR index of both policy factors is near a record low and may serve as a contrarian bullish setup. Perhaps a Fed or Fiscal pivot is finally ahead, or perhaps an unknown scenario we have yet to discover?
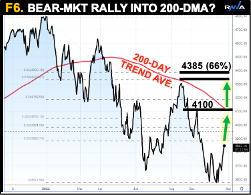
A glance at the S&P500 chart already shows an impulsive relief rally from oversold conditions (Figure 6). Recall that bear-market rally often explodes by an average of 23%. This implies a minimum price objective into 200-day trend average currently trading near 4100, with overshoot risk into 4385 (66% retrace level). Probability, not a certainty. This Halloween, the light-hearted guidance is to craft your pumpkins, not pump your trades too early. Be prudent and Happy Halloween!
By Ron William, CFTe, MSTA
Ron is a market strategist and educator/mentor with more than 20 years of experience working for leading macro research and institutional firms, producing tactical research and trading strategies. He specializes in global, multi-asset, top-down framework, grounded in behavioural technical analysis, driven by cycles based on the “Roadmap” signature model of veteran market technician Robin Griffiths, published in his book “Mapping the Markets.”
Ron also applies a “market & mind” approach at IntensiChi, using the latest techniques in behavioural-risk models and neuroscience sourced from expert groups. He further supplements with mentoring/coaching, trained by the International Coaching Federation (ICF), and teaches a regulatory-approved masterclass in Applied Behavioural Science, with investment, private banks and CFA Societies.
As part of his current institutional market advisory firm (RWA), Ron’s primary work acquired global industry recognition as winner of “Best FX Research” in 2020. Financial media programs and industry publications regularly feature his market insights, including “Is the big cycle about to turn?”, predicting the 2020 crash and alerting the “Minsky paradigm” of 2020 H2-2022.
Driven by high-integrity education, Ron serves as part of the education committee of the International Federation of Technical Analysts (IFTA), Development Director at the Foundation of the Study of Cycles (FSC), Head of SAMT’s Geneva Chapter, and an honorary member of ESTA. He is also a visiting lecturer at universities, active guest speaker for the CFA, CAIA and CISI, and senior teacher at colleges offering an accredited diploma in trading and investing.


Responses